Smithsonian National Museum of Natural History
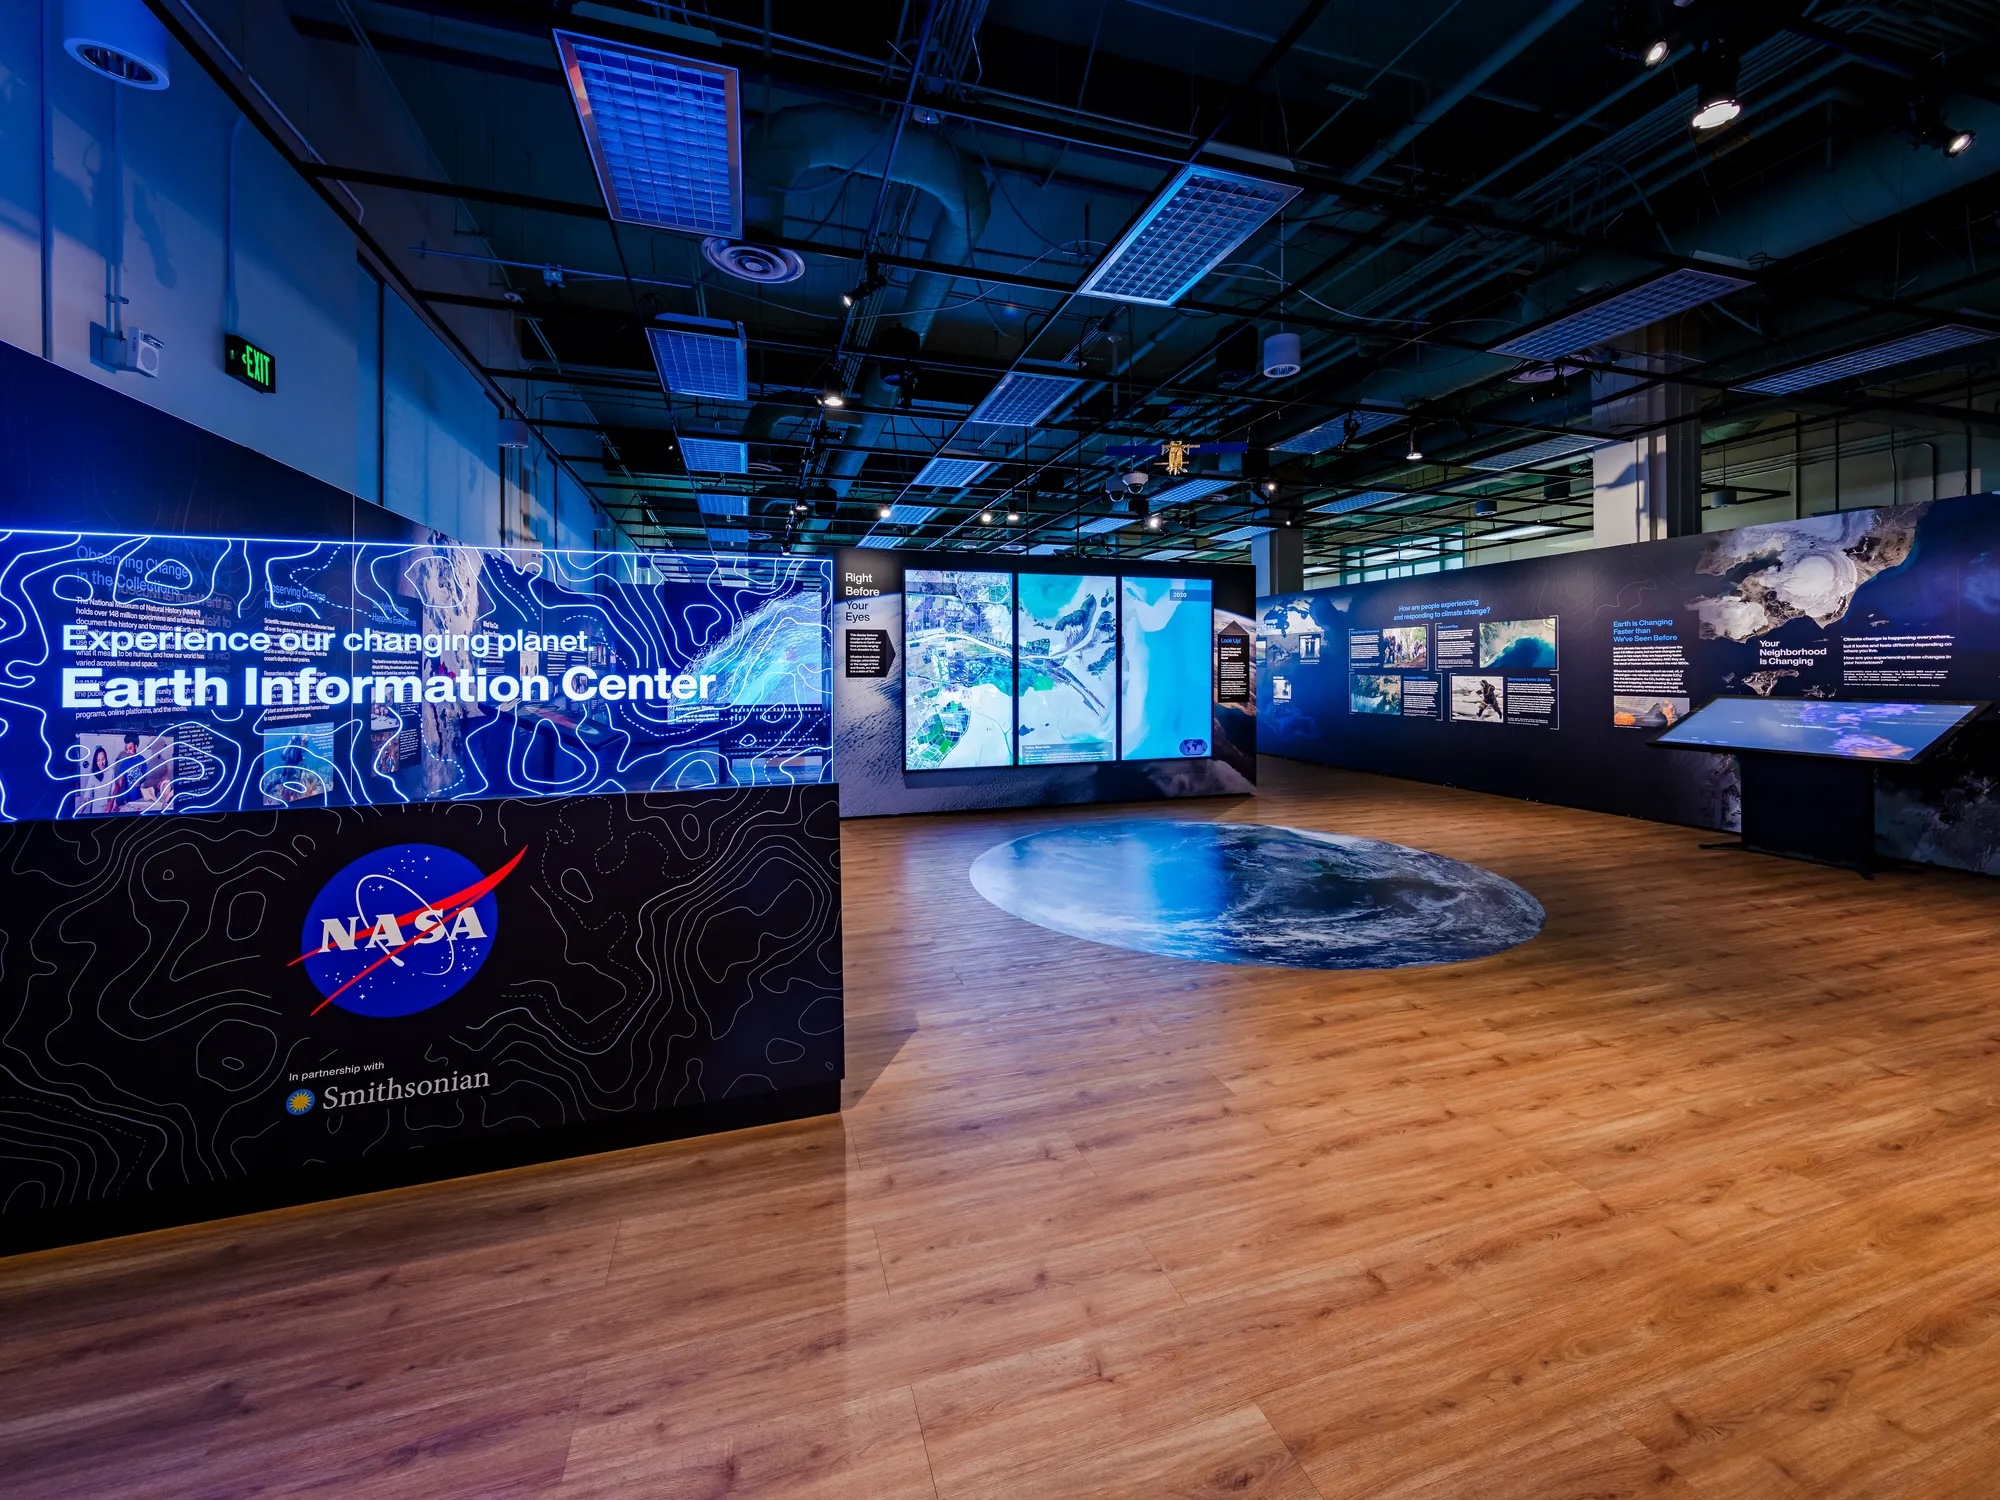
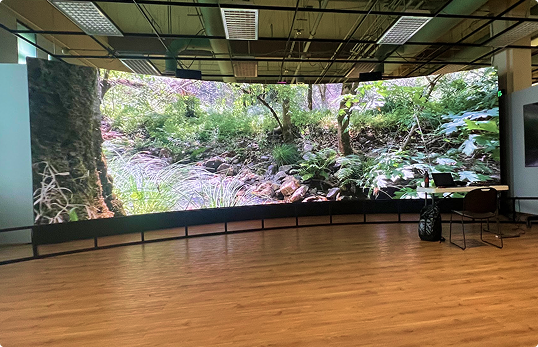
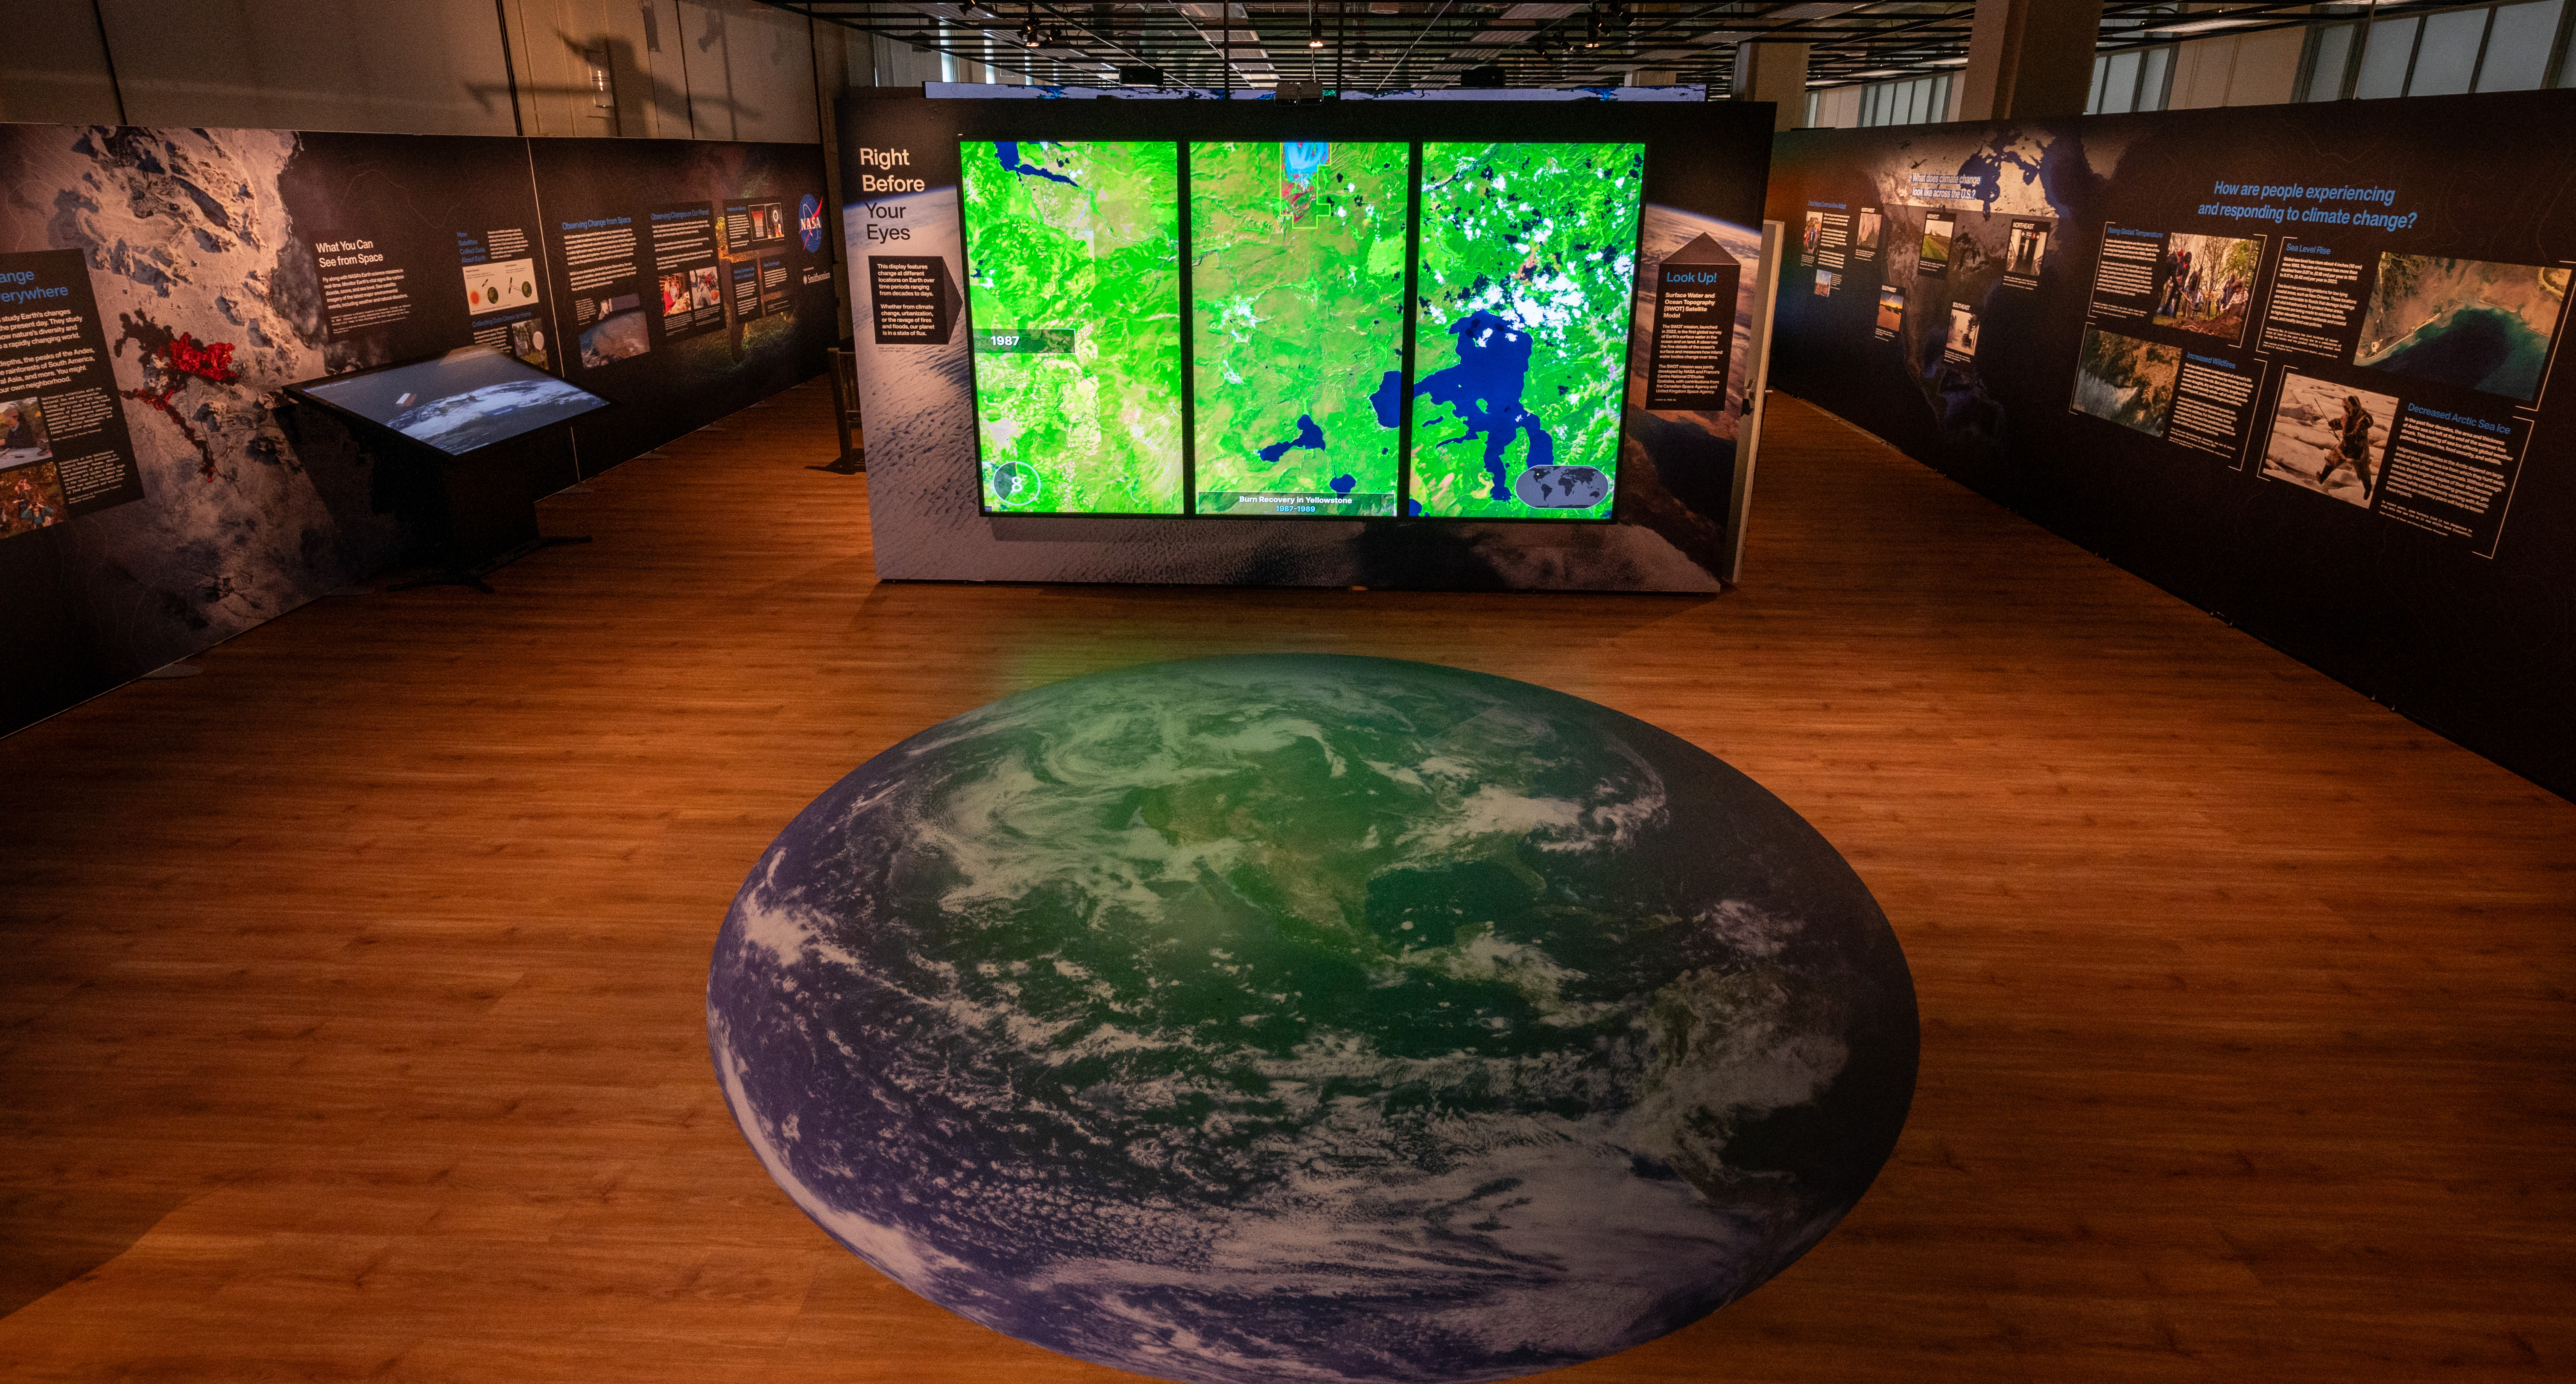
The Earth Information Center exhibit at the Smithsonian’s National Museum of Natural History includes a video wall displaying Earth science data visualizations and videos, an interpretive panel showing Earth’s connected systems, information on our changing world, and an overview of how NASA and the Smithsonian study our home planet.
| Admission | Free |
|---|---|
| Hours | Every day (except Dec 25), 10am - 5:30pm |
| Address | Smithsonian National Museum of Natural History, 2nd Floor 1000 Madison Drive NW Washington, D.C. 20560 |
FEATURES
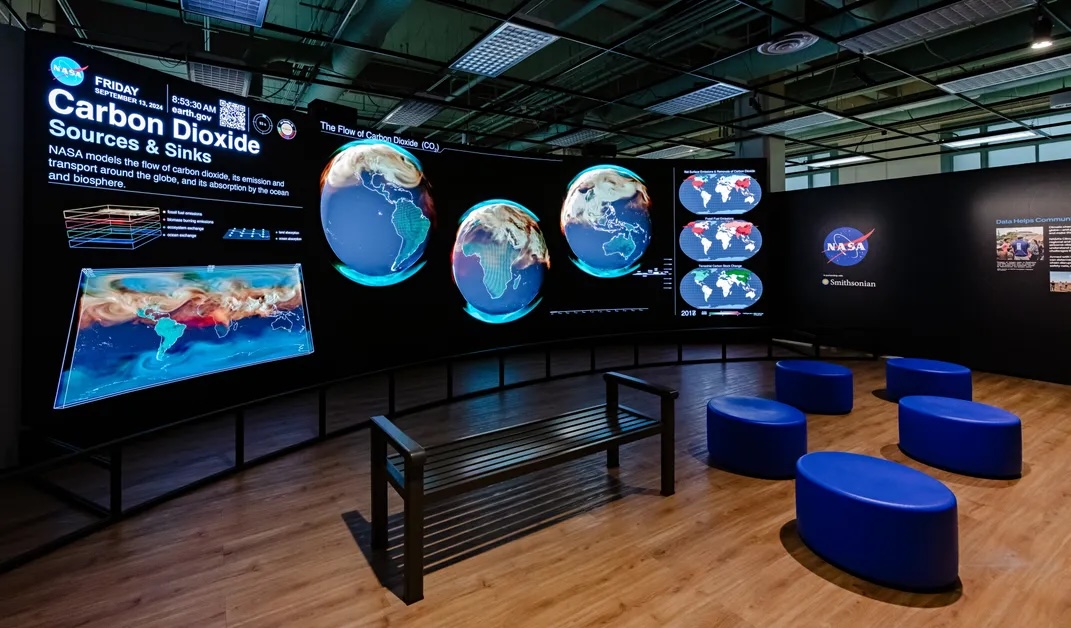
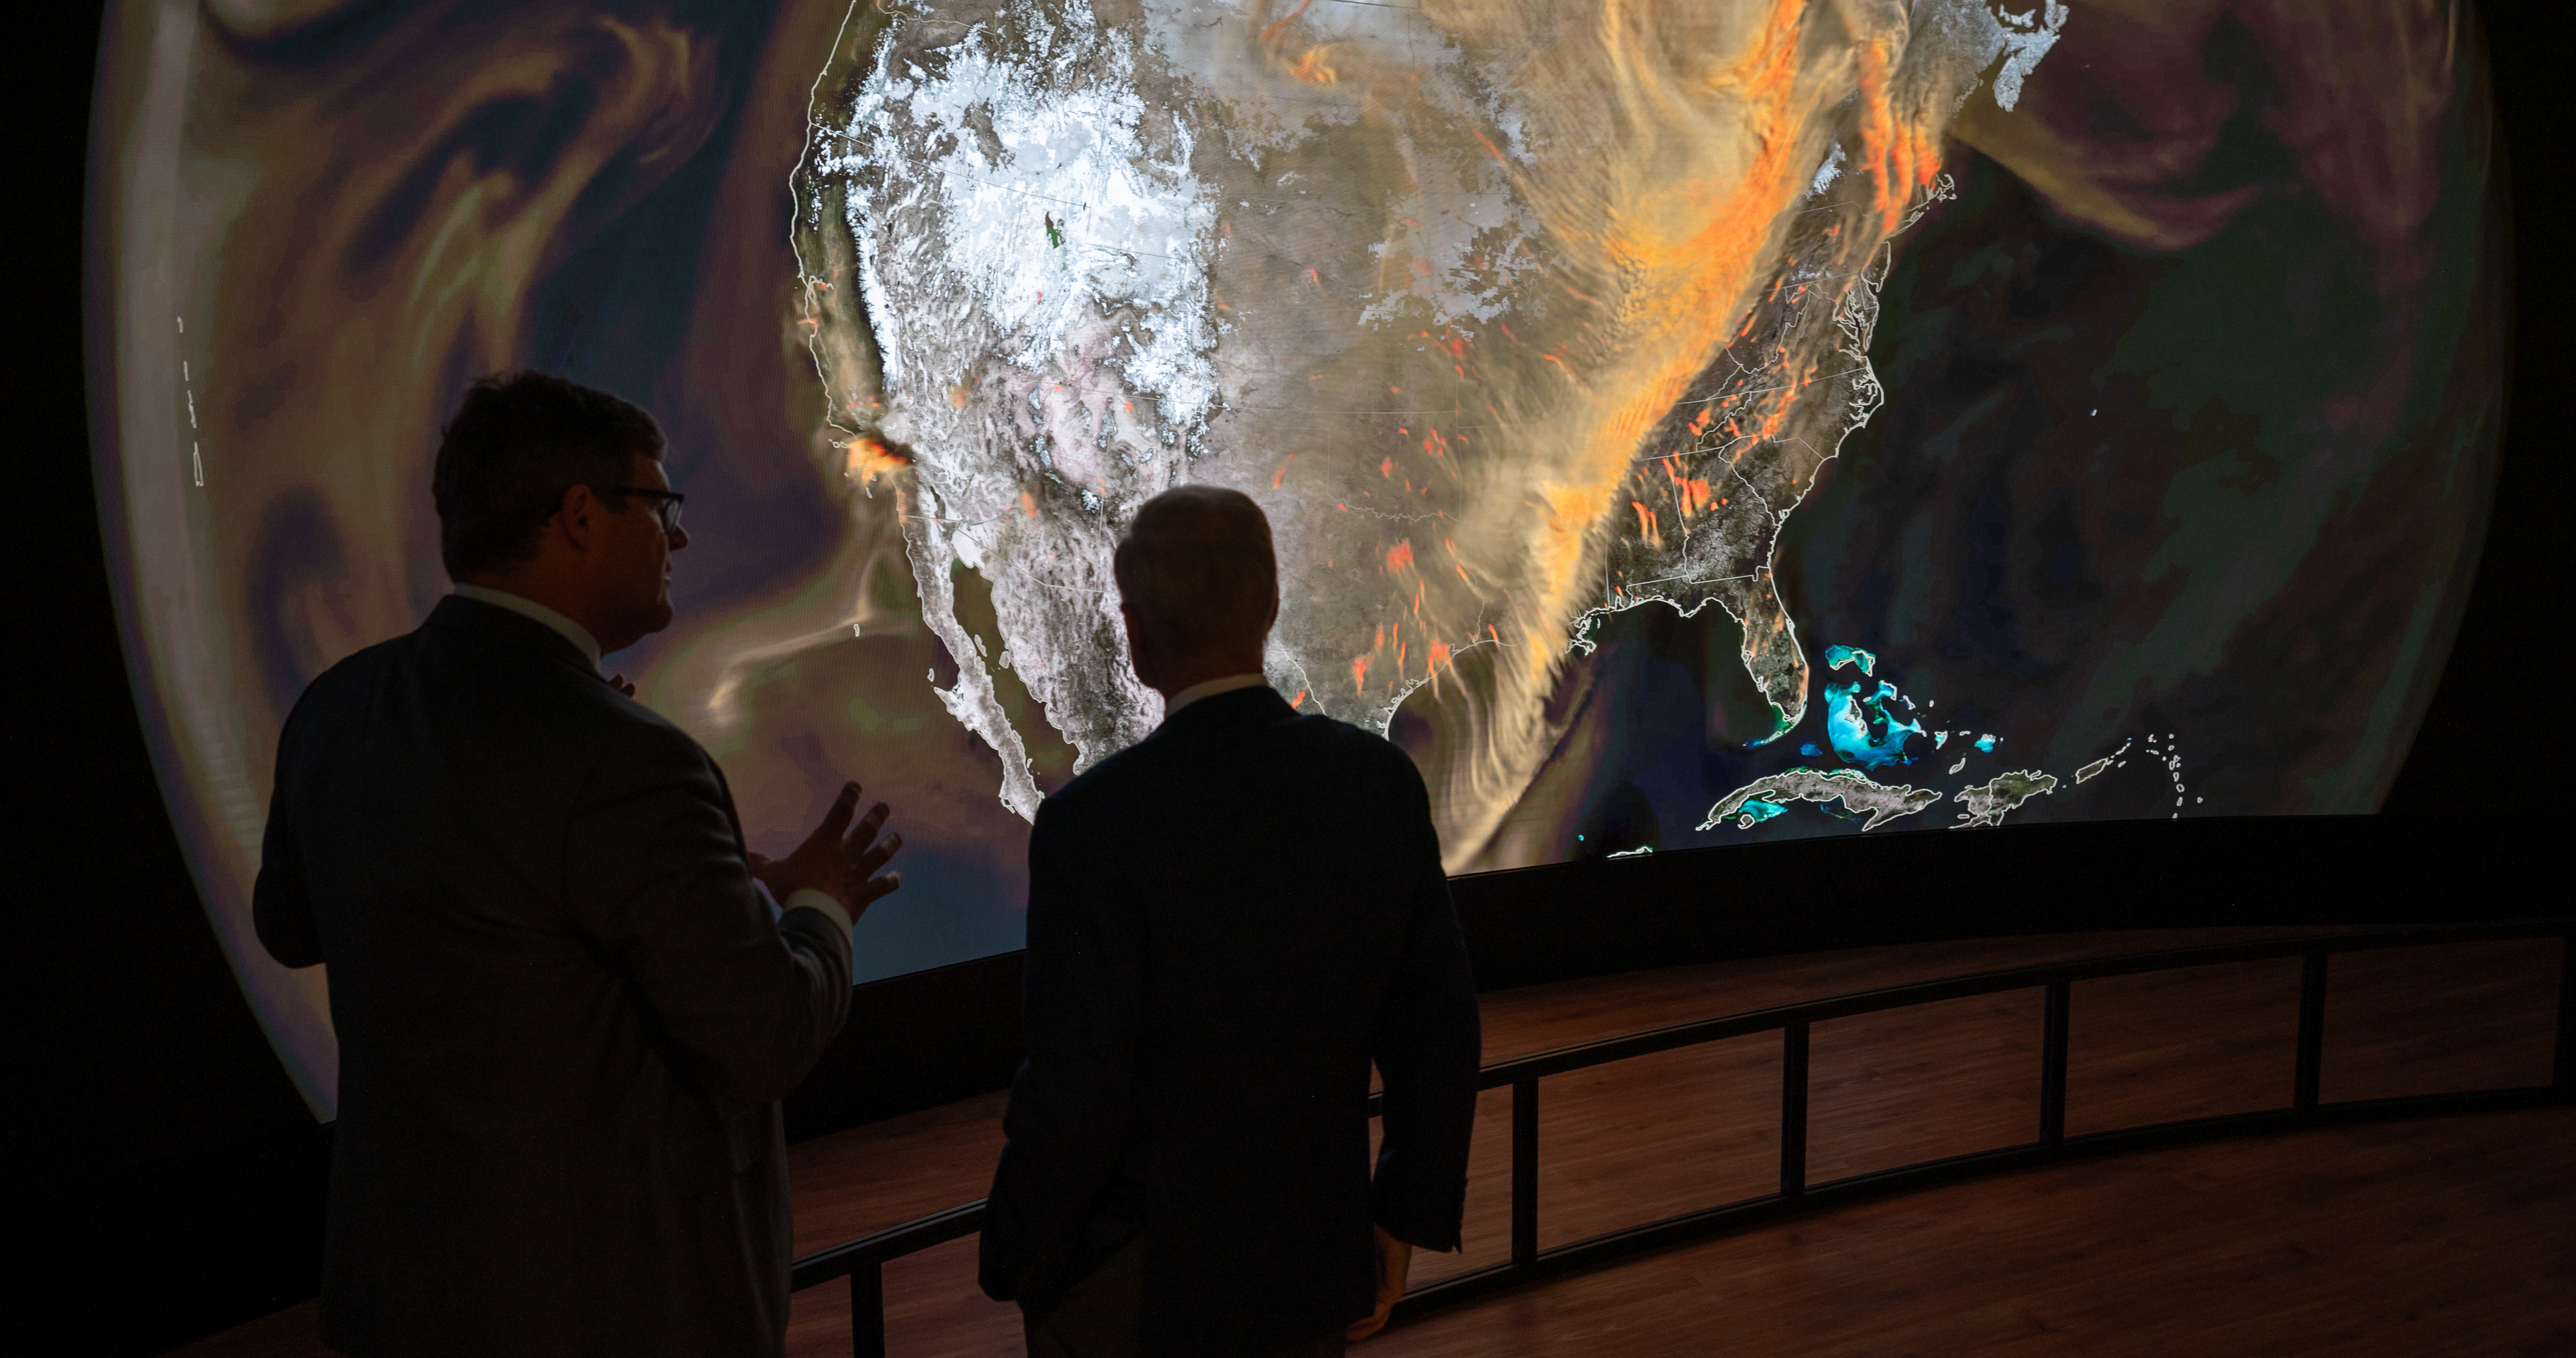
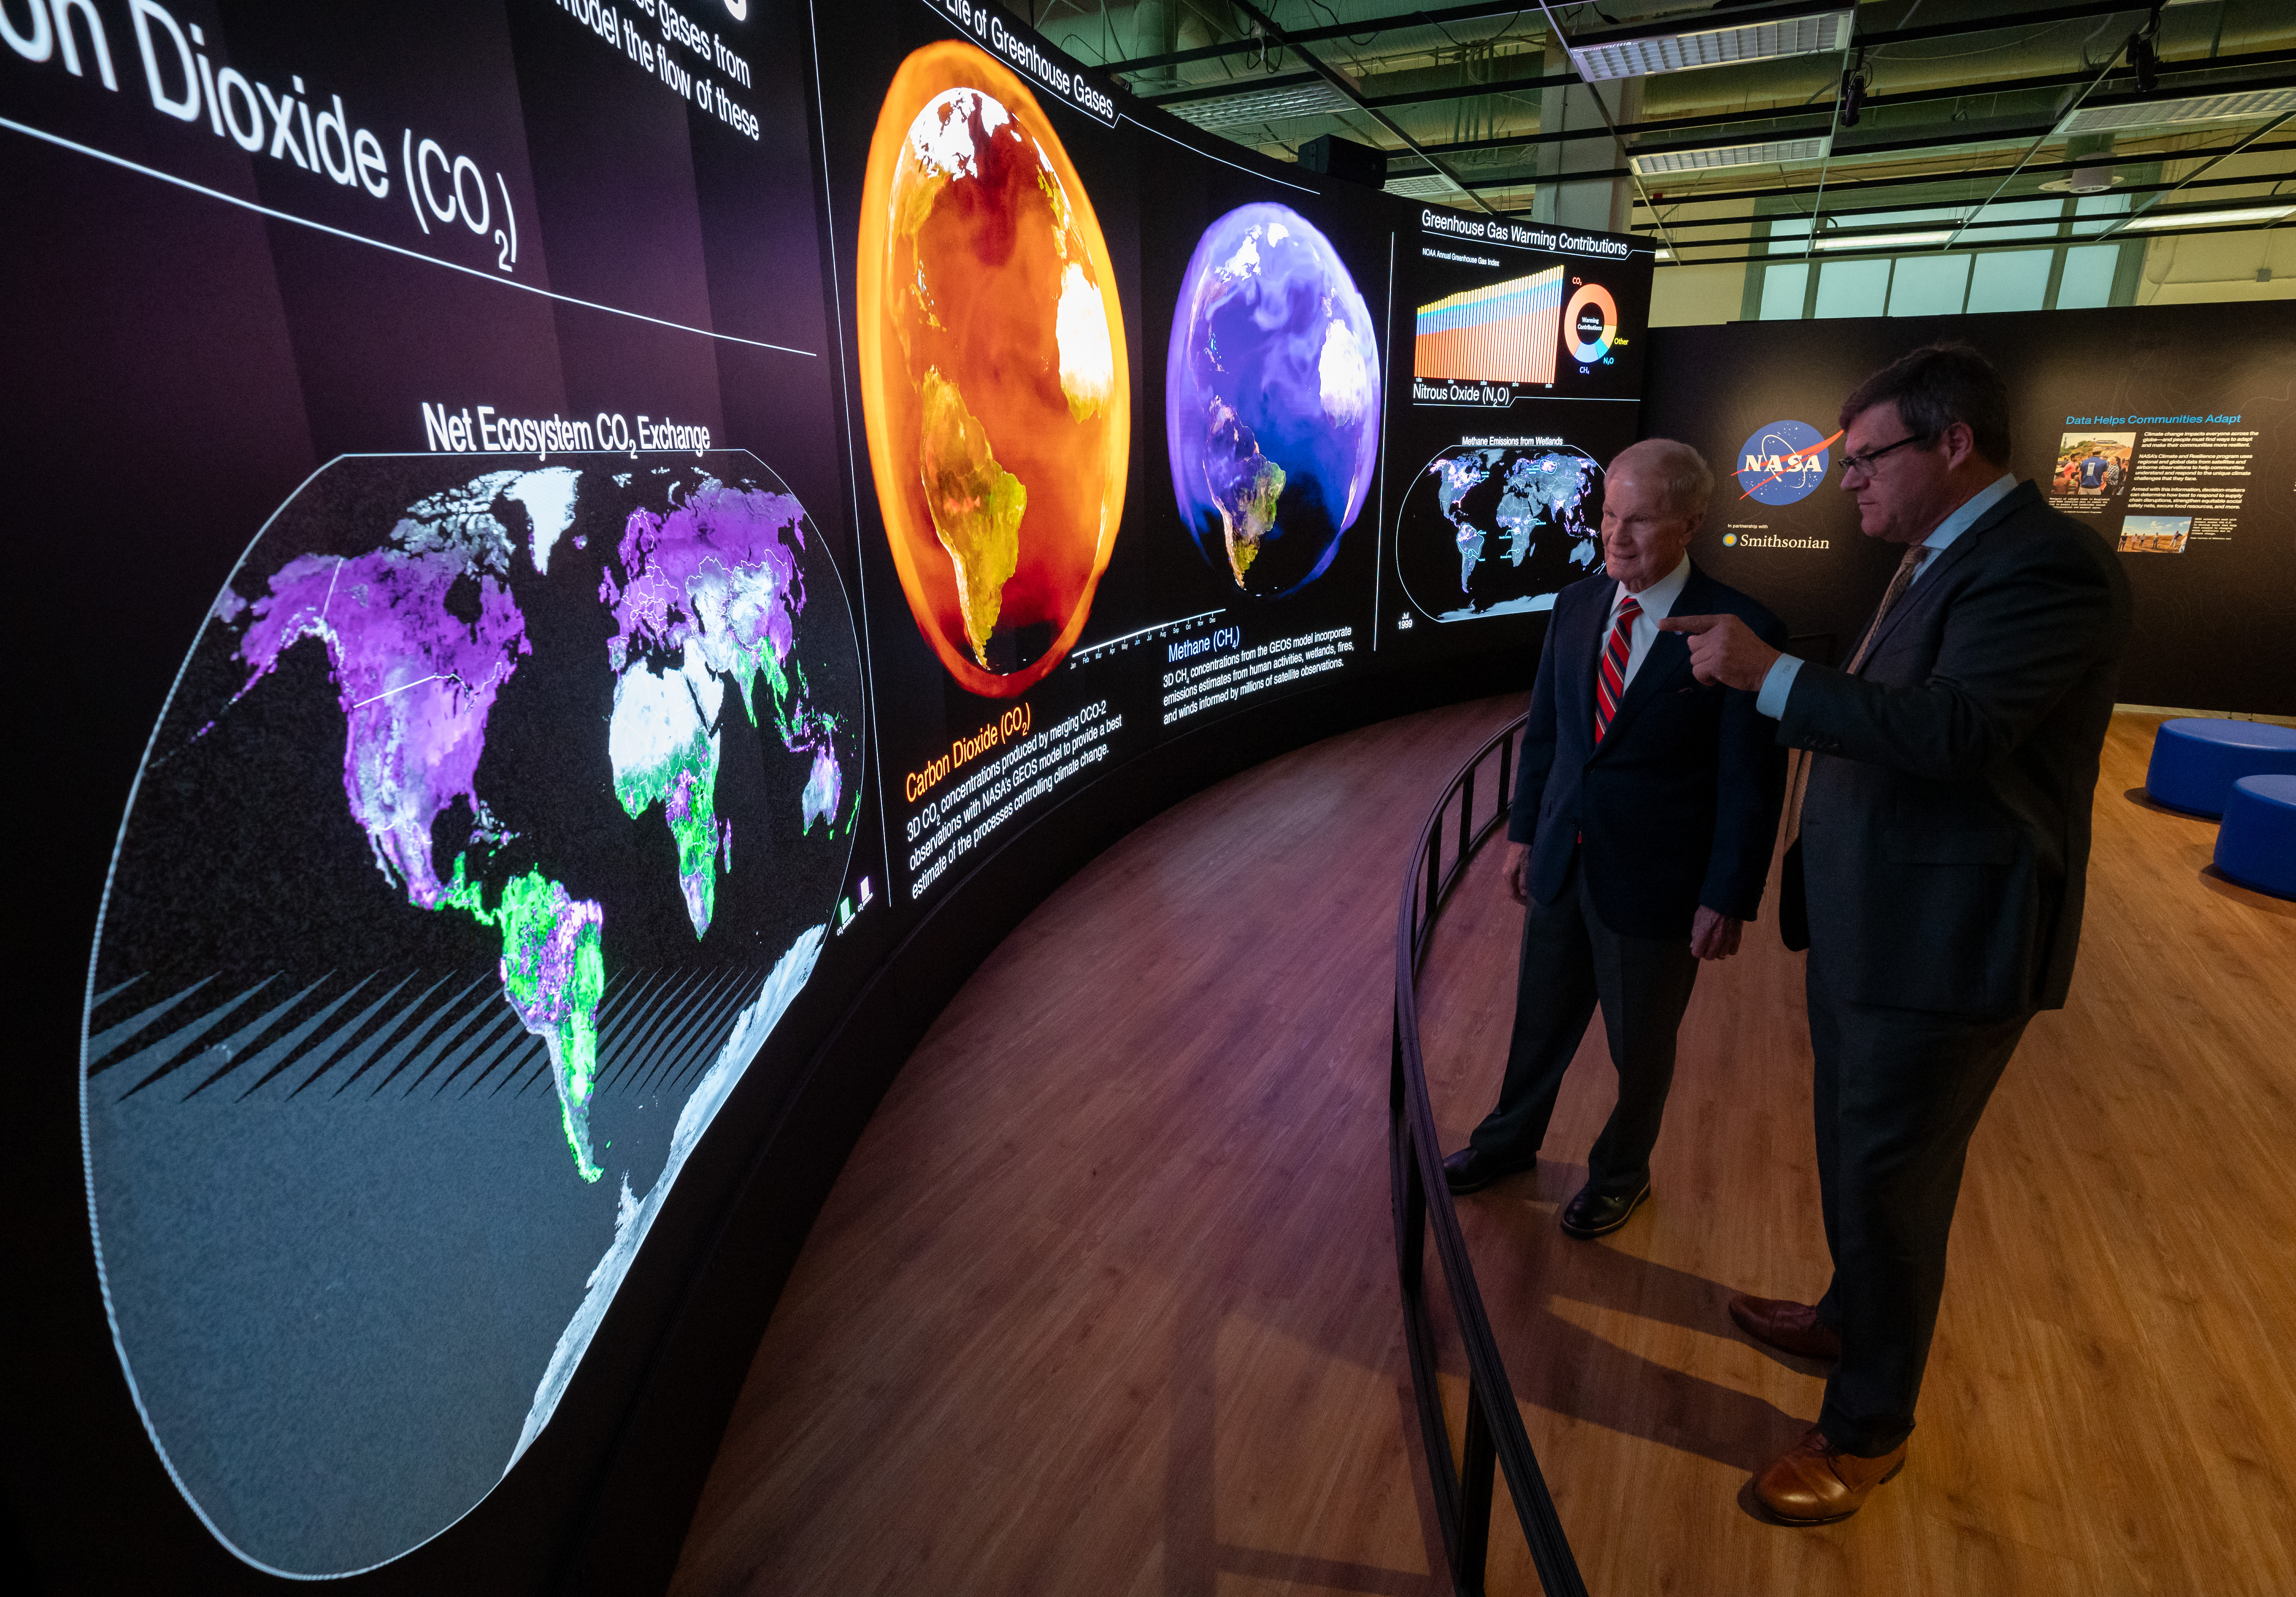
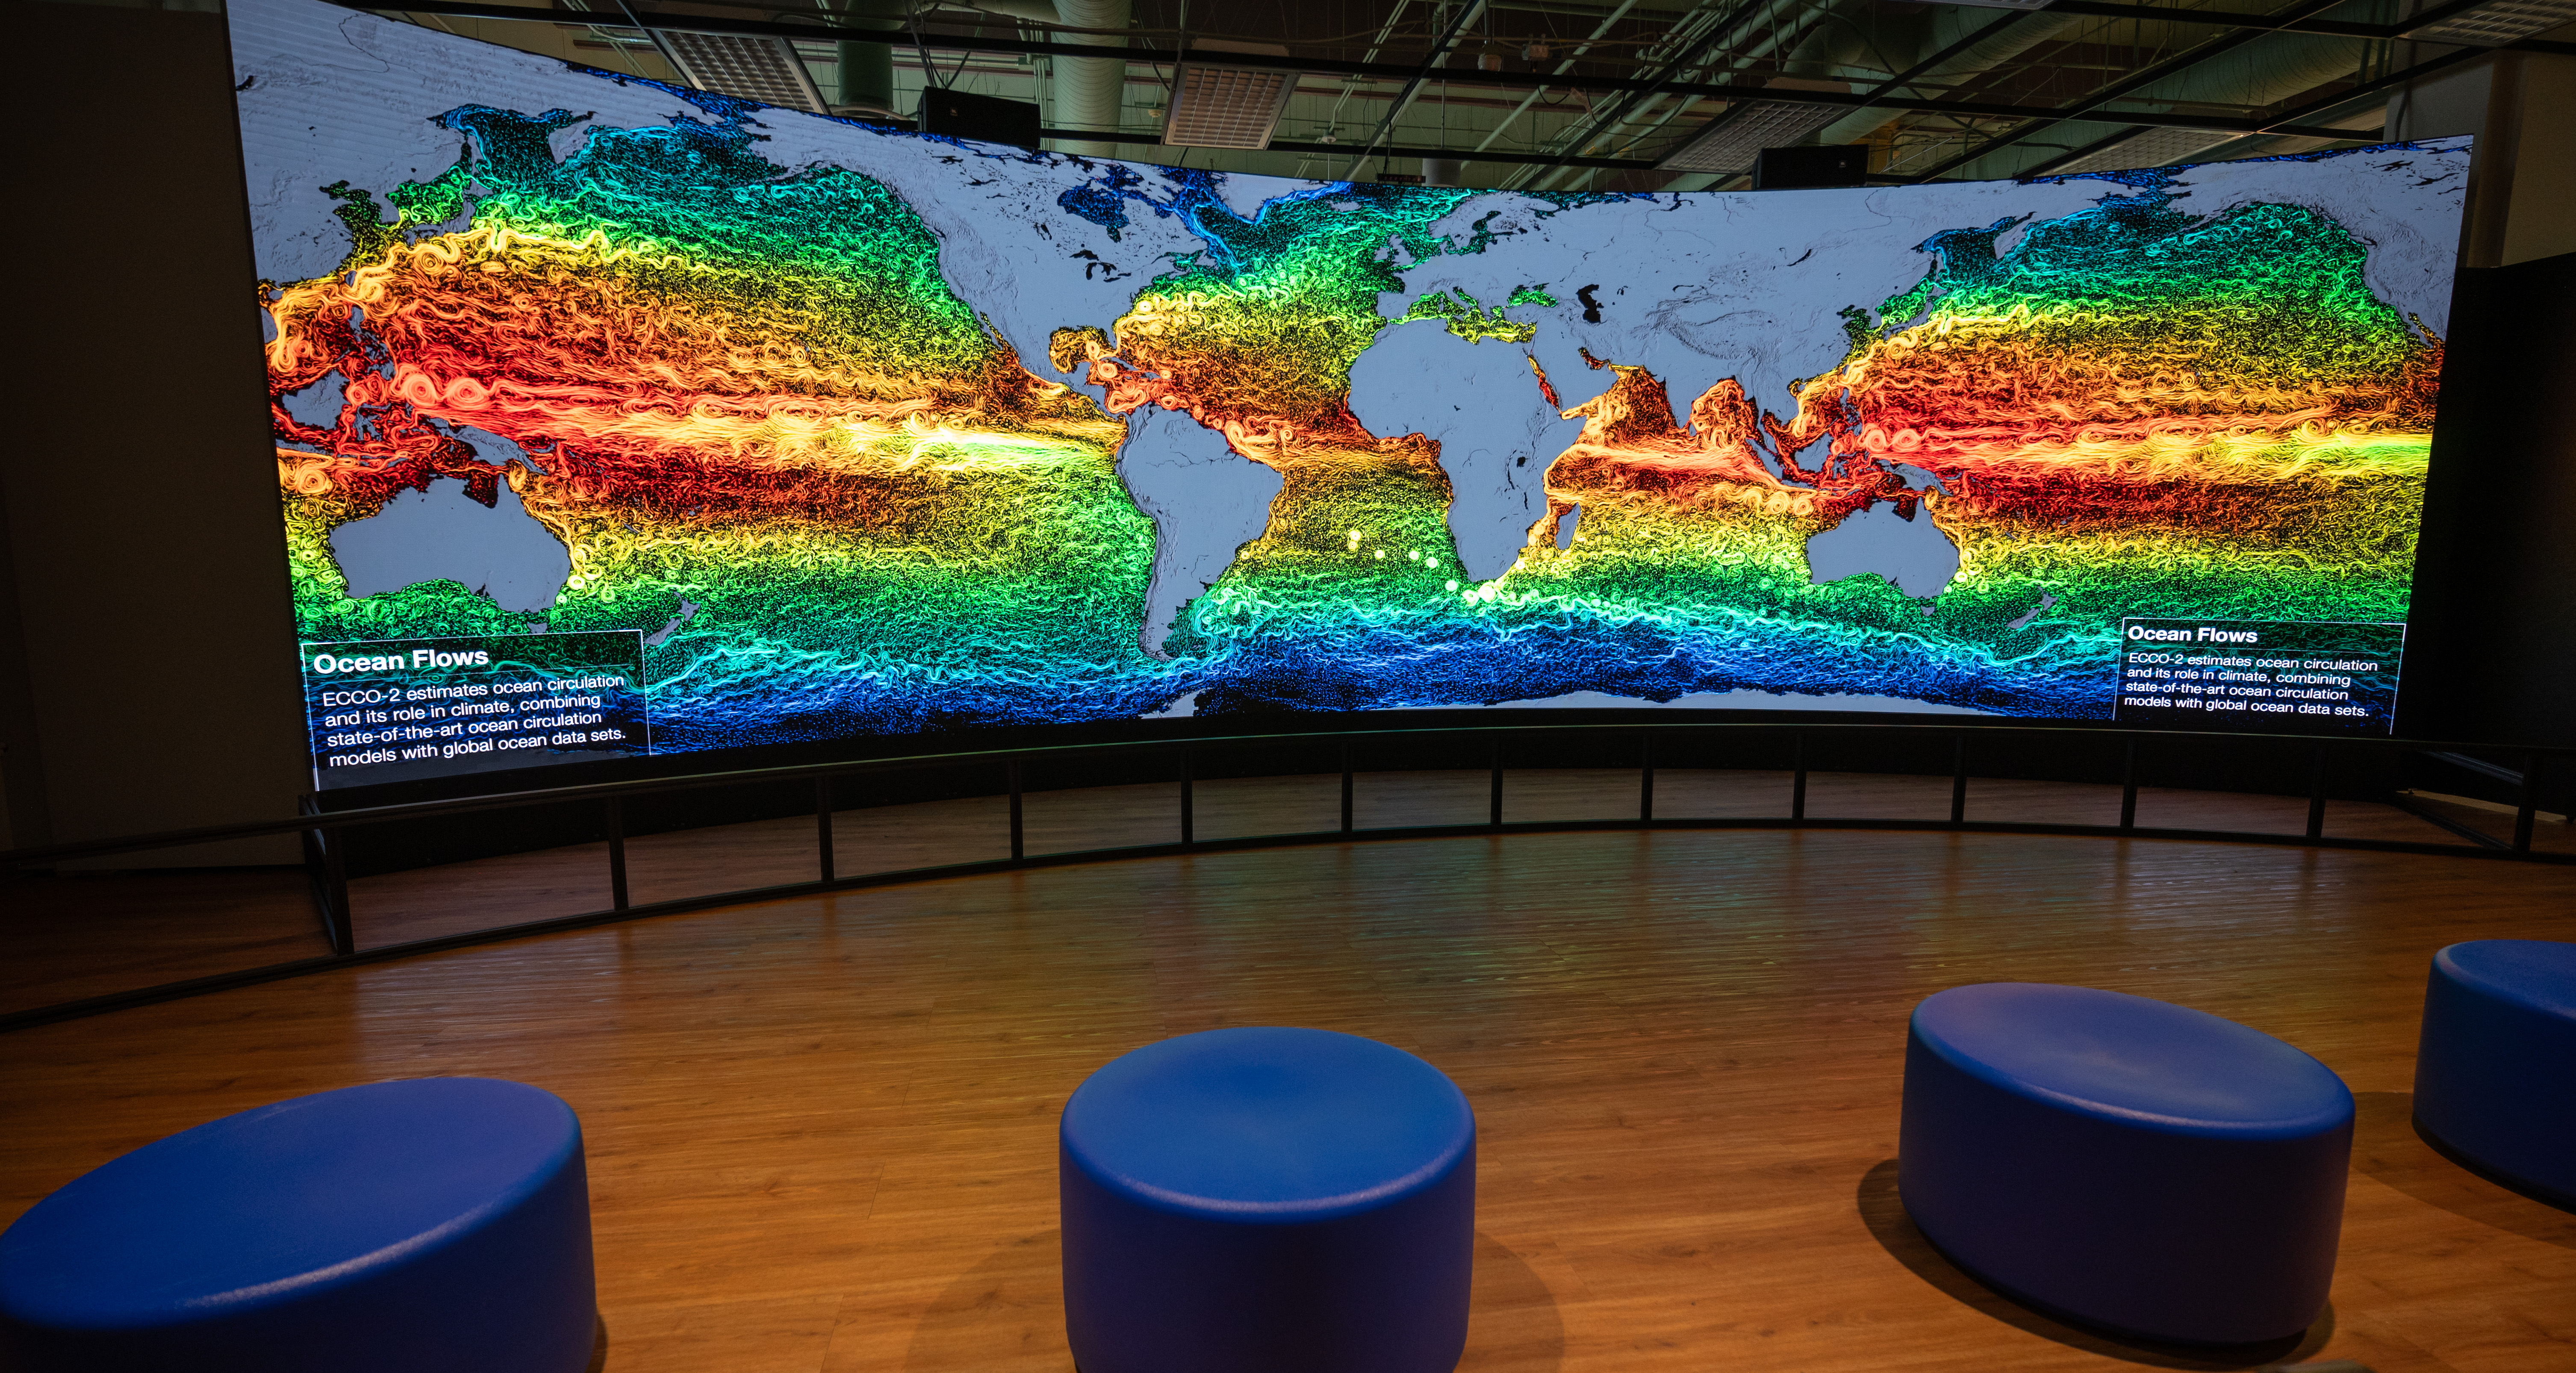
The Hyperwall features videos, dashboards with real-time data on climate and Earth science, along with dazzling imagery of our planet. The Earth Information Center collects information about Earth on a variety of scales ranging from ground-based data to space-based observations from all our inter-agency partners. Collecting information at each scale is important and, when combined, provides a comprehensive understanding of how the components of the atmosphere, land and ocean influence each other. With this understanding the datasets become more powerful tools for addressing environmental challenges and climate change.
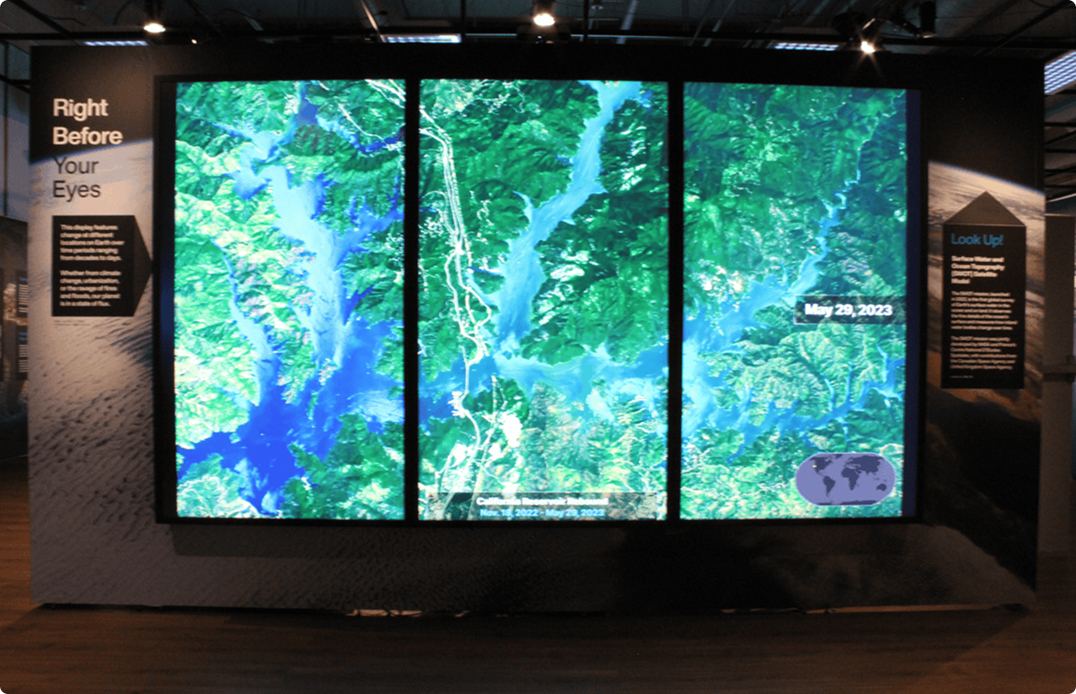
Spanning periods from days to decades, satellite imagery reveals changes in Earth's landscape over time. At the exhibit, visitors use their silhouette and movement to uncover images from before and after a range of events, including flooding, urbanization, fires, and more. This interactive experience demonstrates some of the human impact on our planet.
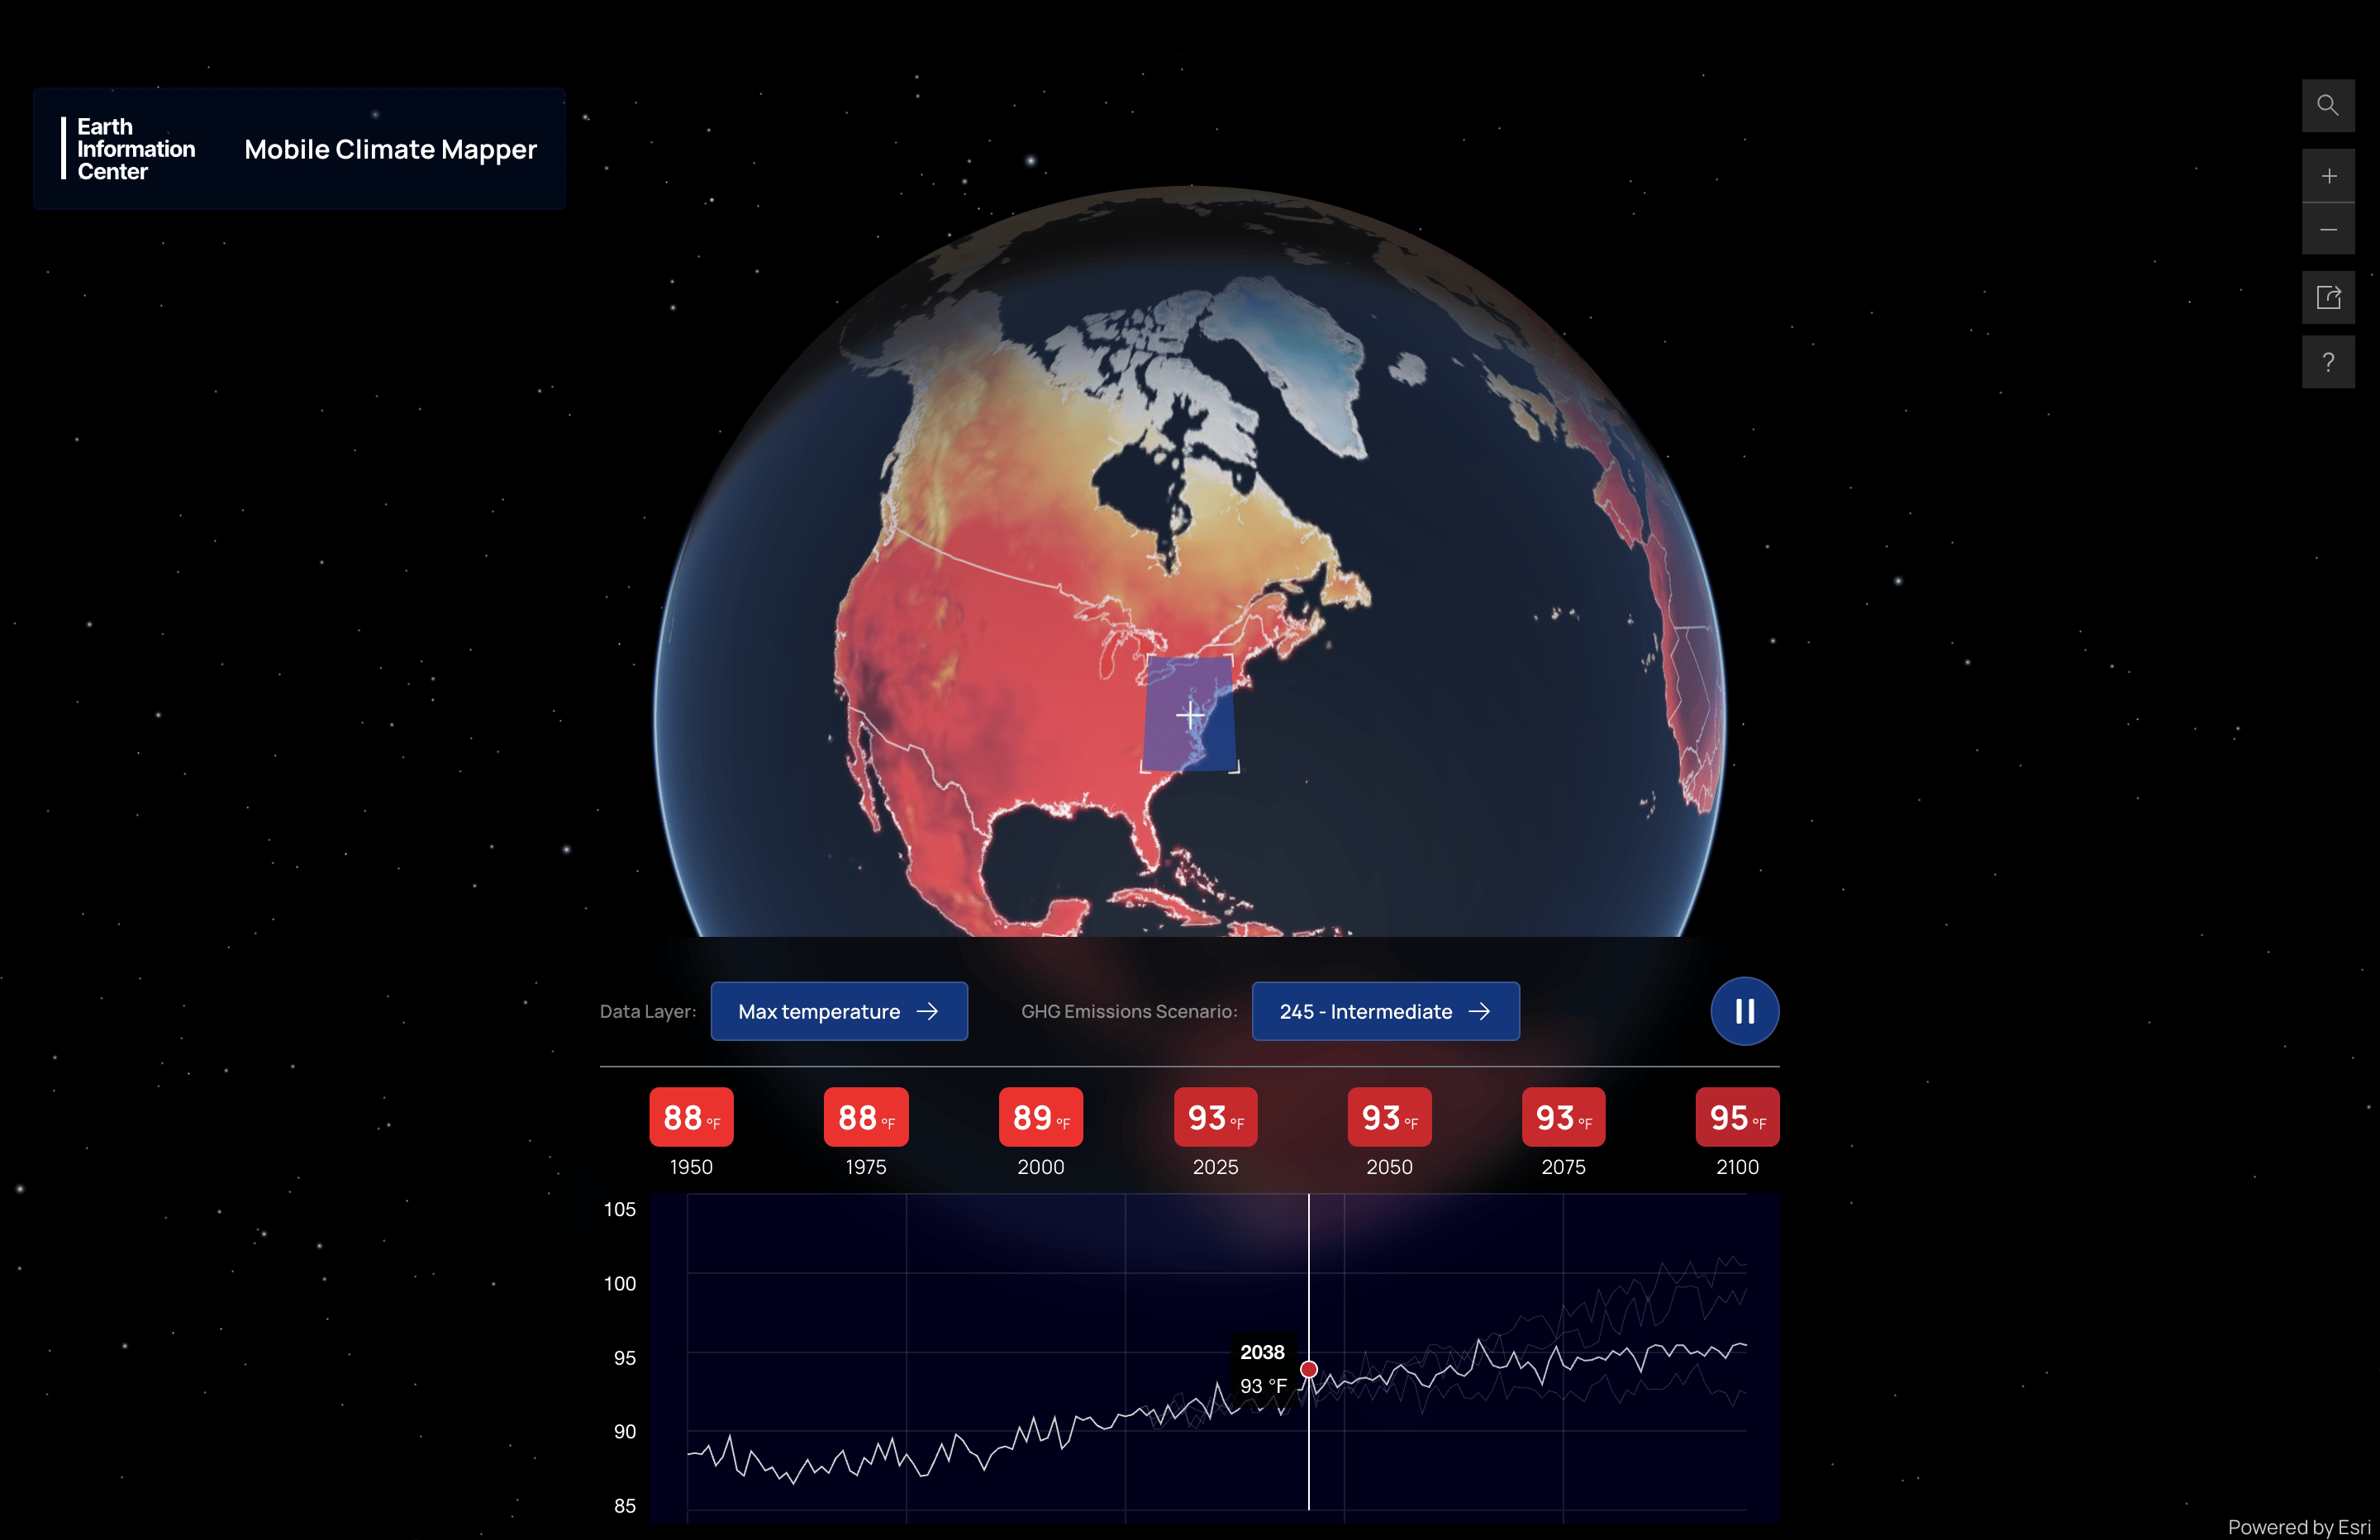
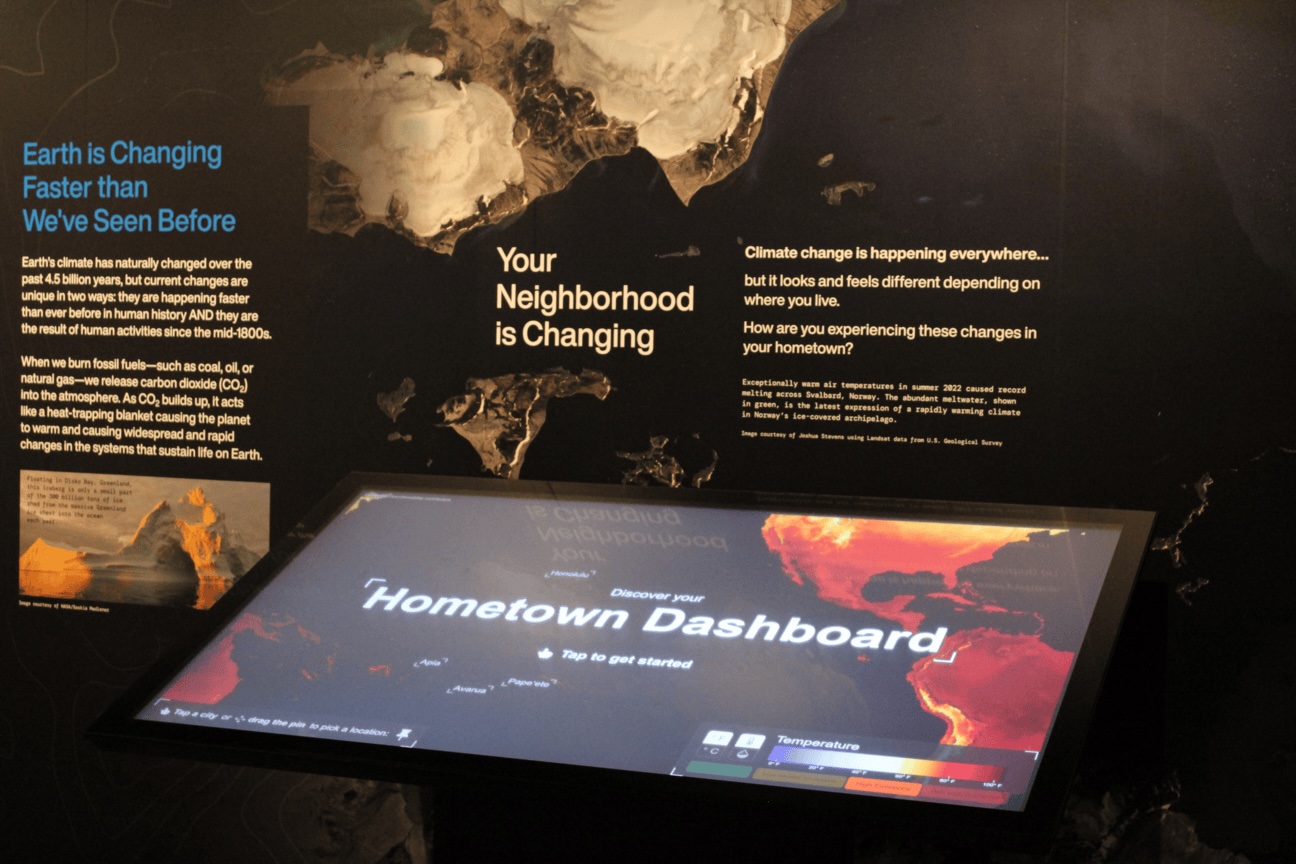
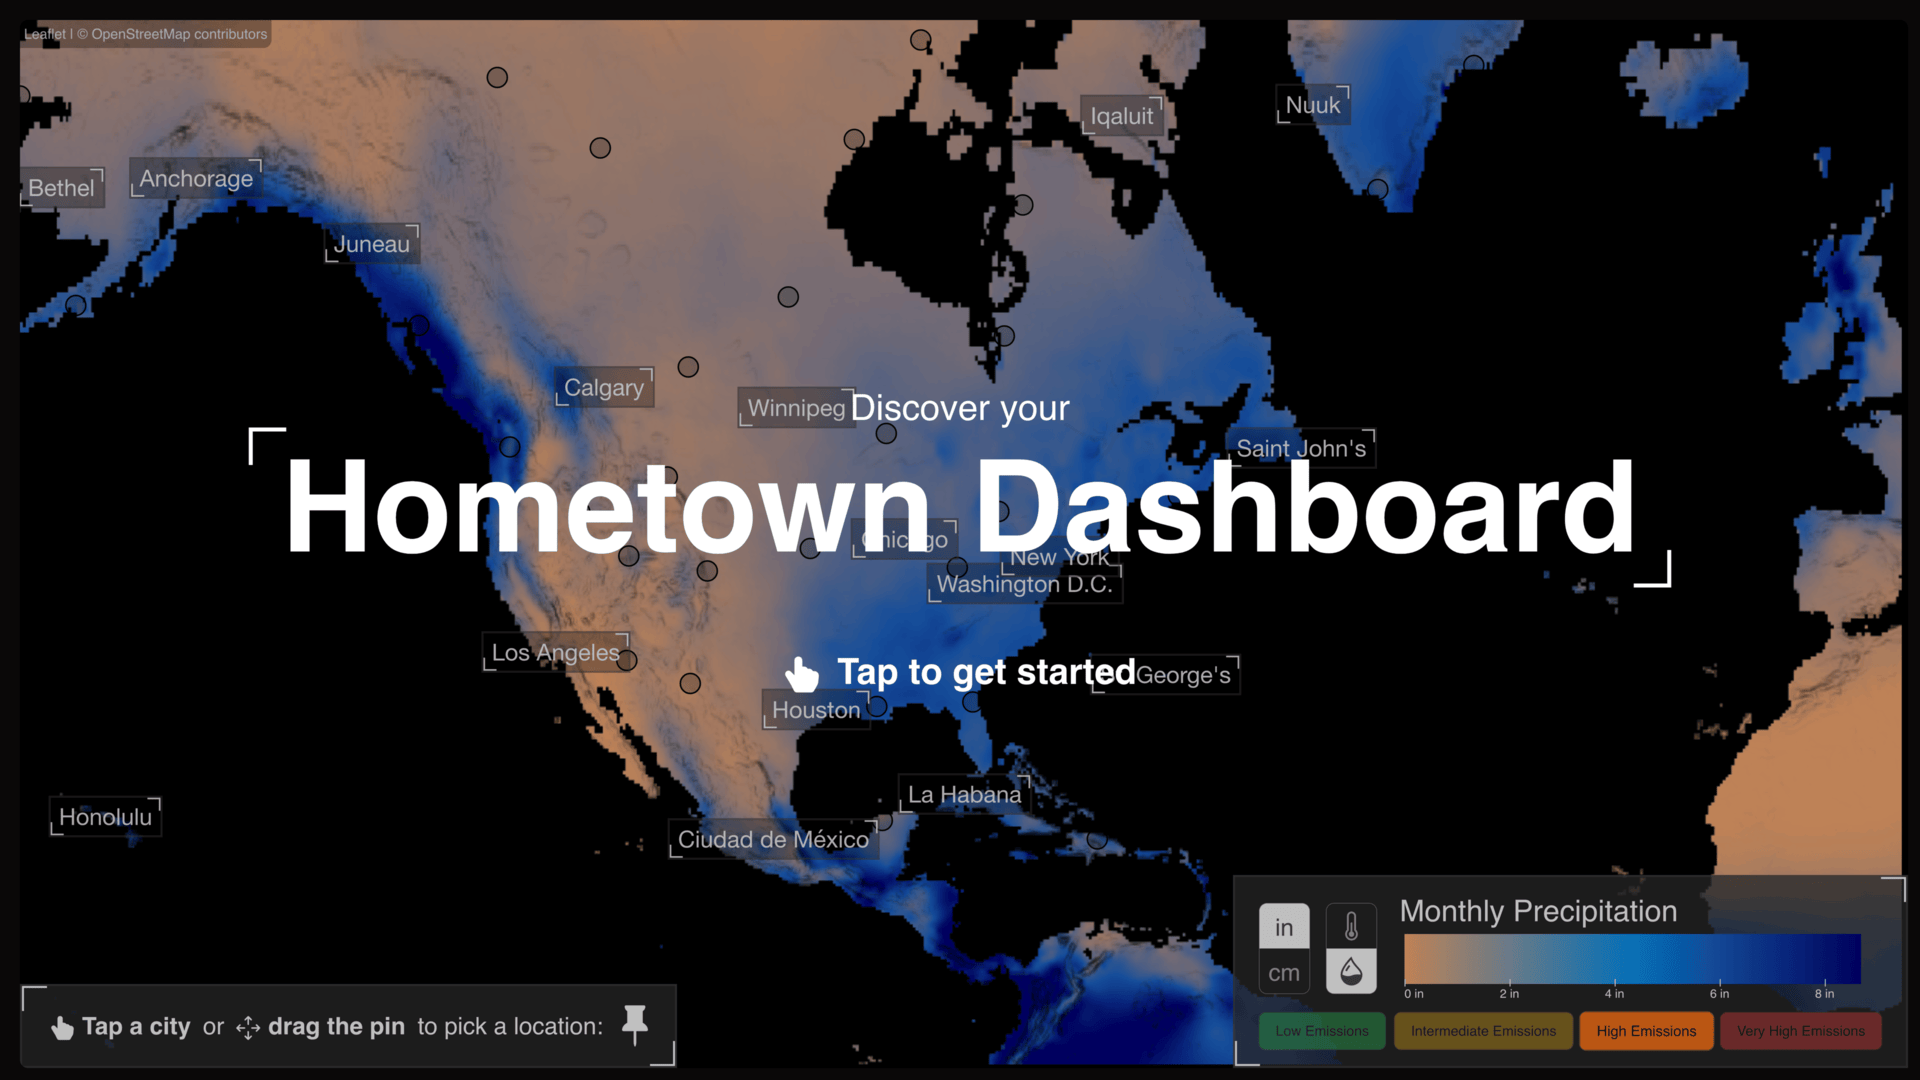
This interactive display invites users to learn how temperature and precipitation in their home region are projected to change from 1950 to 2100. Select your hometown from a global map, adjust time scales, and interact with visual charts that show historical and predicted climate changes based on different emission scenarios. What future will you choose?
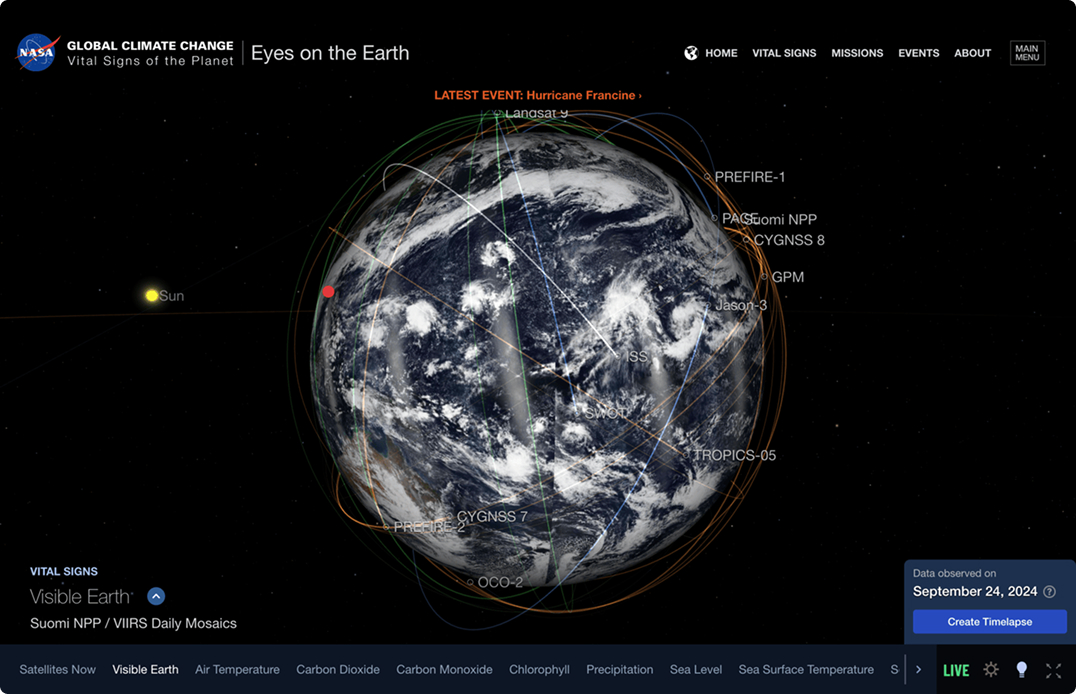
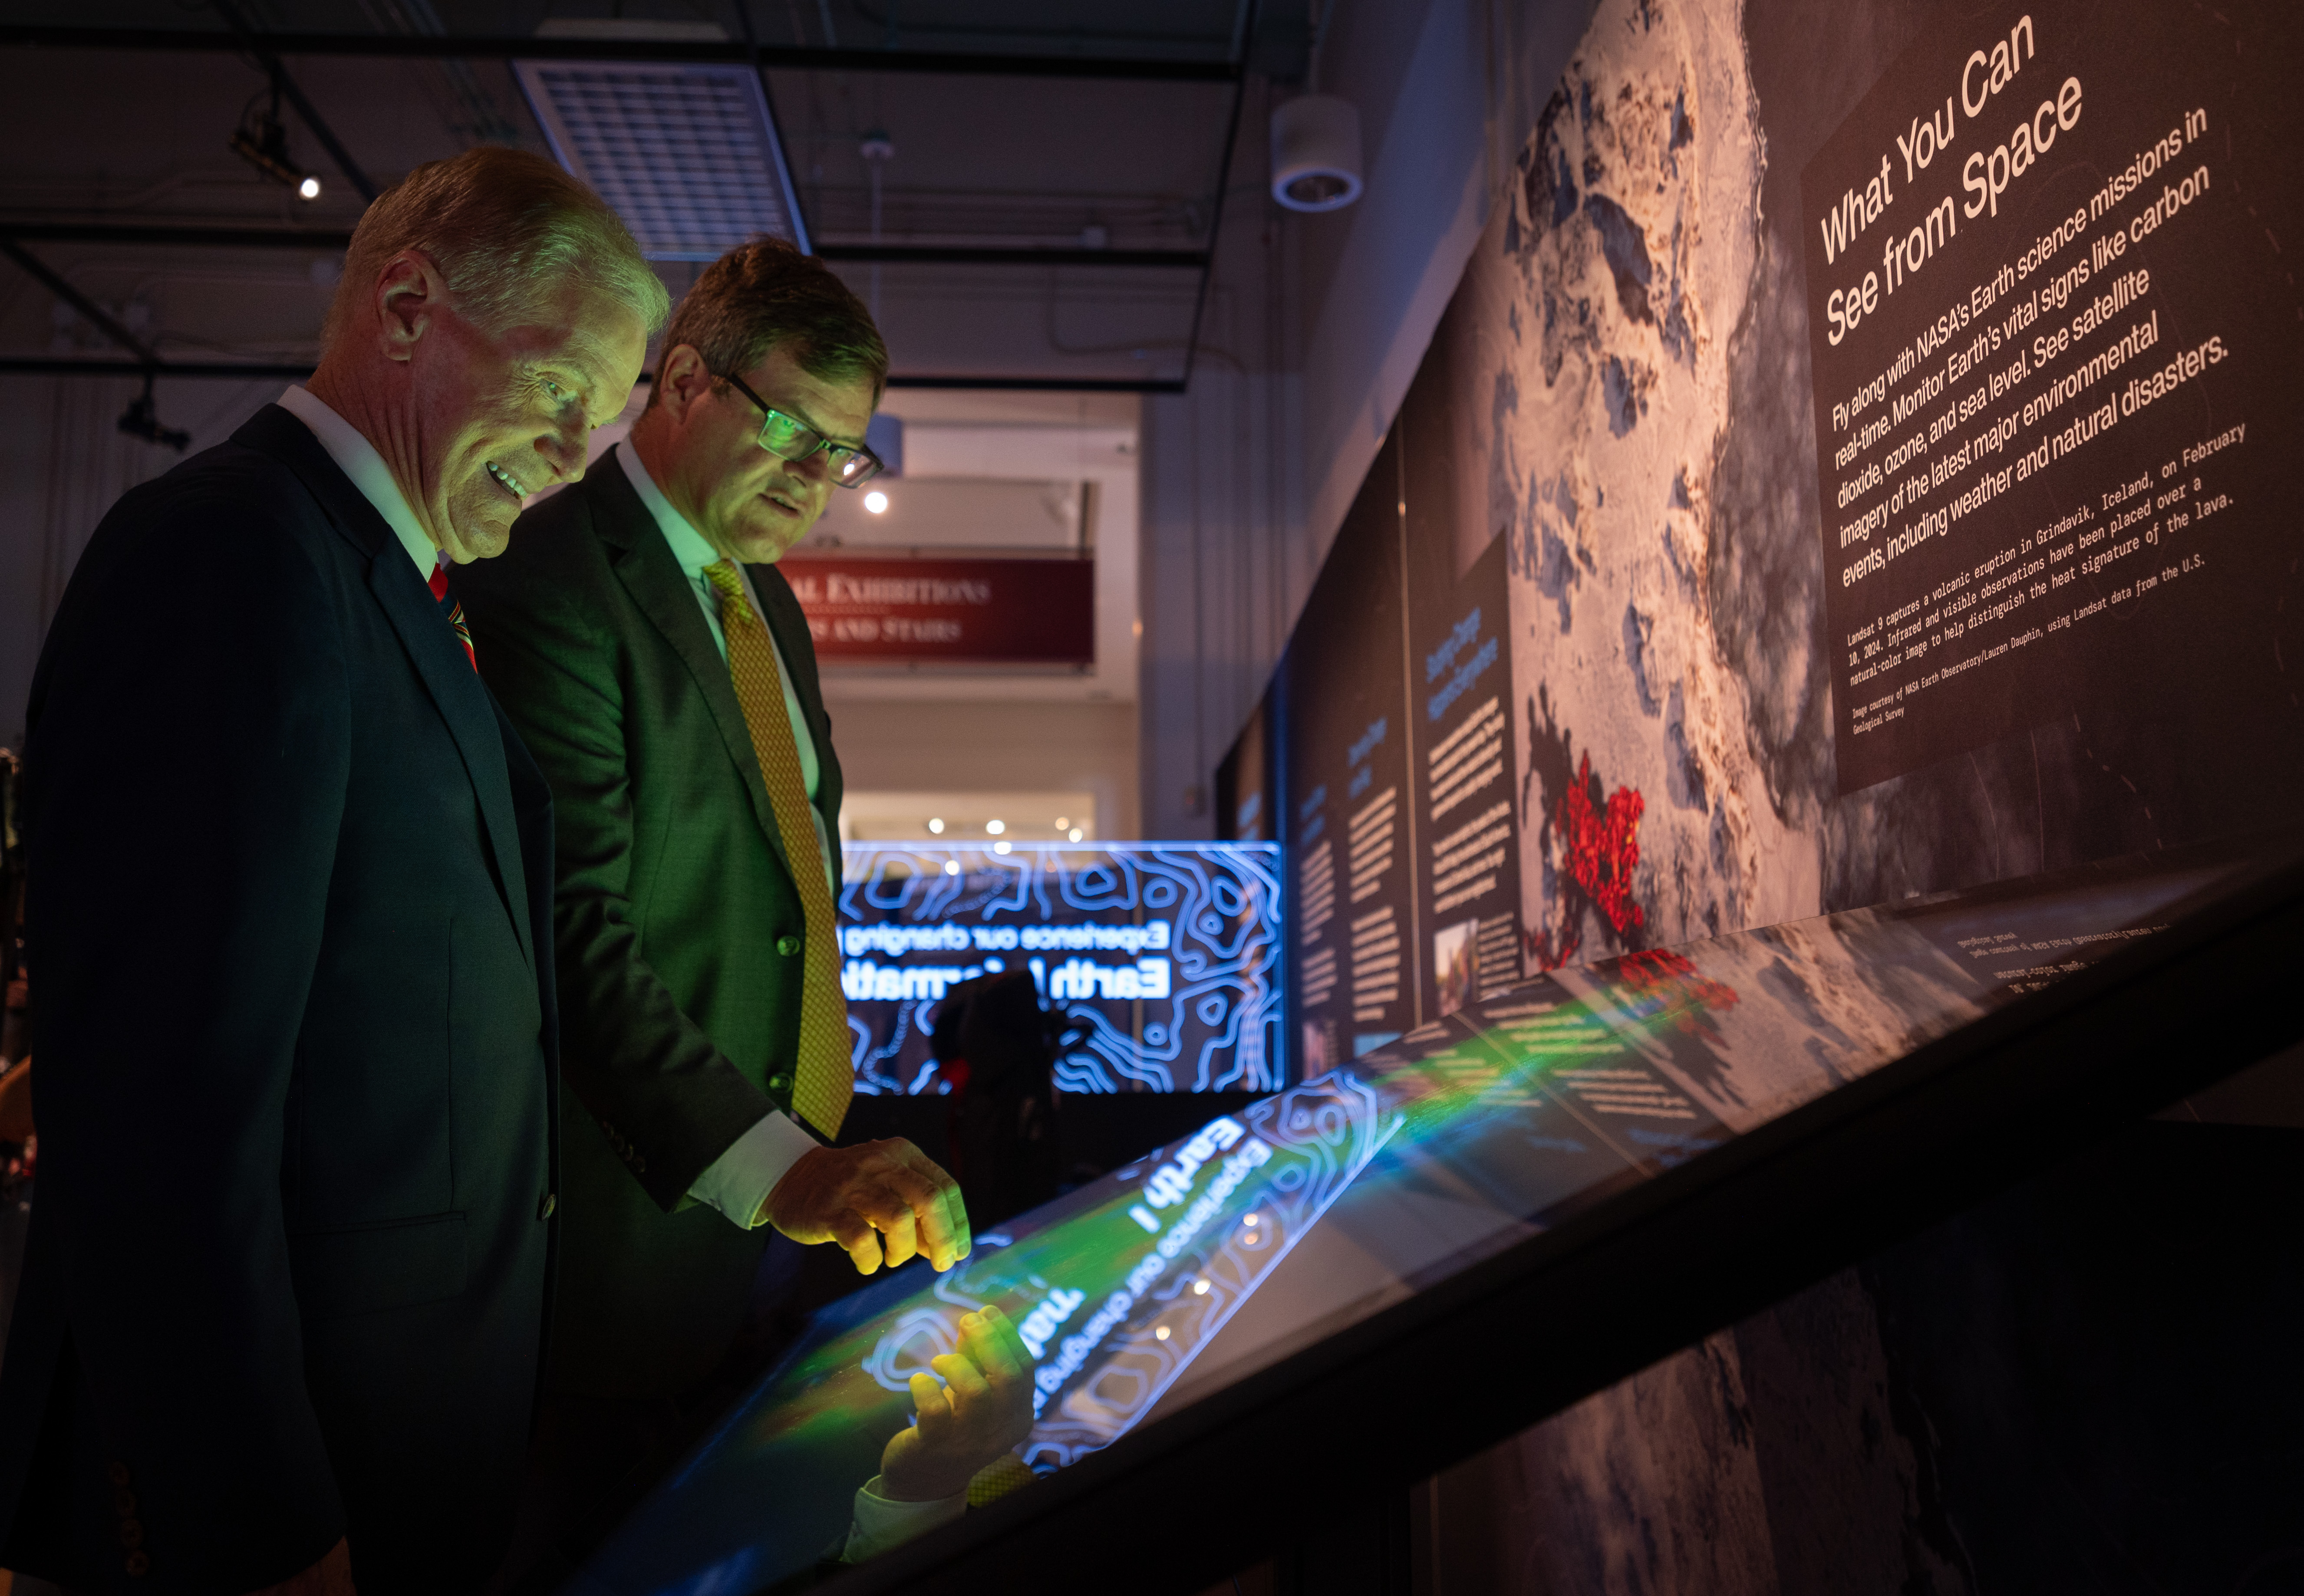
This interactive tool allows users to fly along with NASA's Earth observing missions in real-time, view satellite imagery of recent weather events, and monitor some of Earth's vital signs, including temperature, carbon dioxide, atmospheric ozone, and sea level. The kiosk has a touch screen for users to scroll to their location of interest, select a satellite to learn more about a mission, and interact with the 3D globe.
This app allows users to explore temperature data between 1950 to 2100 a mobile device or computer. While selecting different emission scenarios and timeframes, users interact with a 3D globe to select a region of interest and reveal charts of historical and predicted temperatures.